WAIS INSIGHT · AVIATION GEOGRAPHY
The Geography of Global Airport Traffic in 2025
Global airport traffic is distributed across a highly uneven geographic system. In 2025, the 951 airports in the WAIS World Airports Ranking handled approximately 9.52 billion passenger movements across 11 world regions, revealing major differences in the scale, concentration and spatial structure of air transport worldwide.
2025 DATA · PASSENGER TRAFFIC · 11 WORLD REGIONS
KEY FINDINGS
951
AIRPORTS
The WAIS World Airports Ranking covers 951 airports handling at least one million passengers in 2025.
9.52BN
PASSENGERS
Together, the 951 airports recorded approximately 9.52 billion passenger movements in 2025.
11
OF WAIS TRAFFIC
WAIS organizes the global airport system into eleven geographic regions designed for consistent worldwide comparison.
65.1%
THREE LARGEST REGIONS
East Asia, North America and Europe together account for 65.1% of passenger traffic across the WAIS airport system.
AIRPORT TRAFFIC BY WORLD REGION
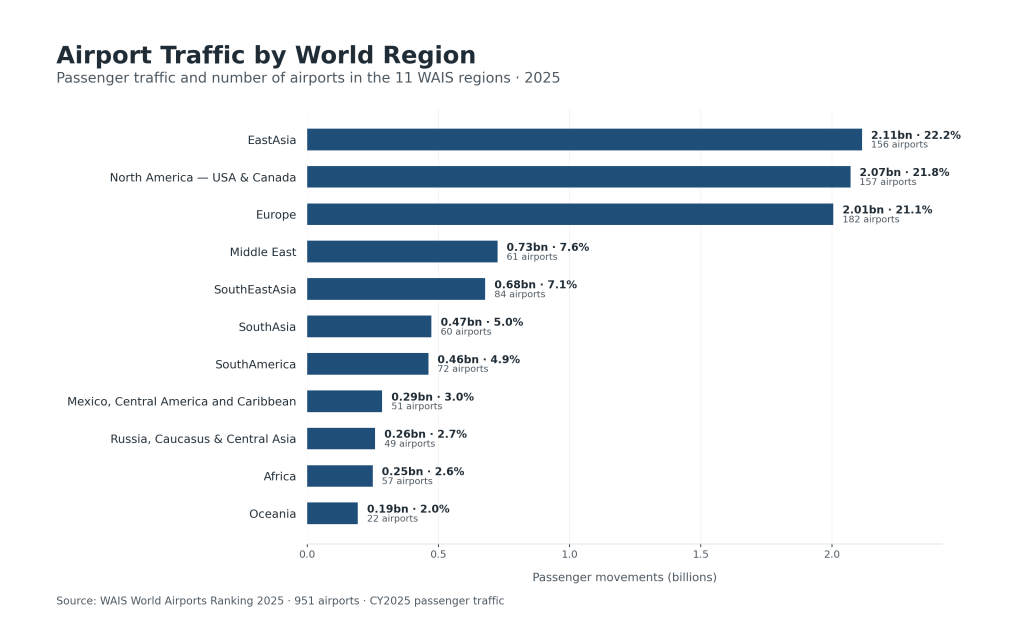
The geography of global airport traffic is dominated by three major regions. East Asia, North America and Europe each handled more than two billion passenger movements in 2025. Together, they accounted for nearly two thirds of passenger traffic across the 951 airports in the WAIS ranking.
Beyond these three centres, the distribution becomes considerably more dispersed. The Middle East and Southeast Asia each handled close to 700 million passengers, while South Asia and South America each approached half a billion. Africa, Oceania, Russia–Caucasus–Central Asia and the Mexico–Central America–Caribbean region form smaller, but geographically distinct, components of the global airport system.
AIRPORTS AND TRAFFIC ARE NOT DISTRIBUTED EQUALLY
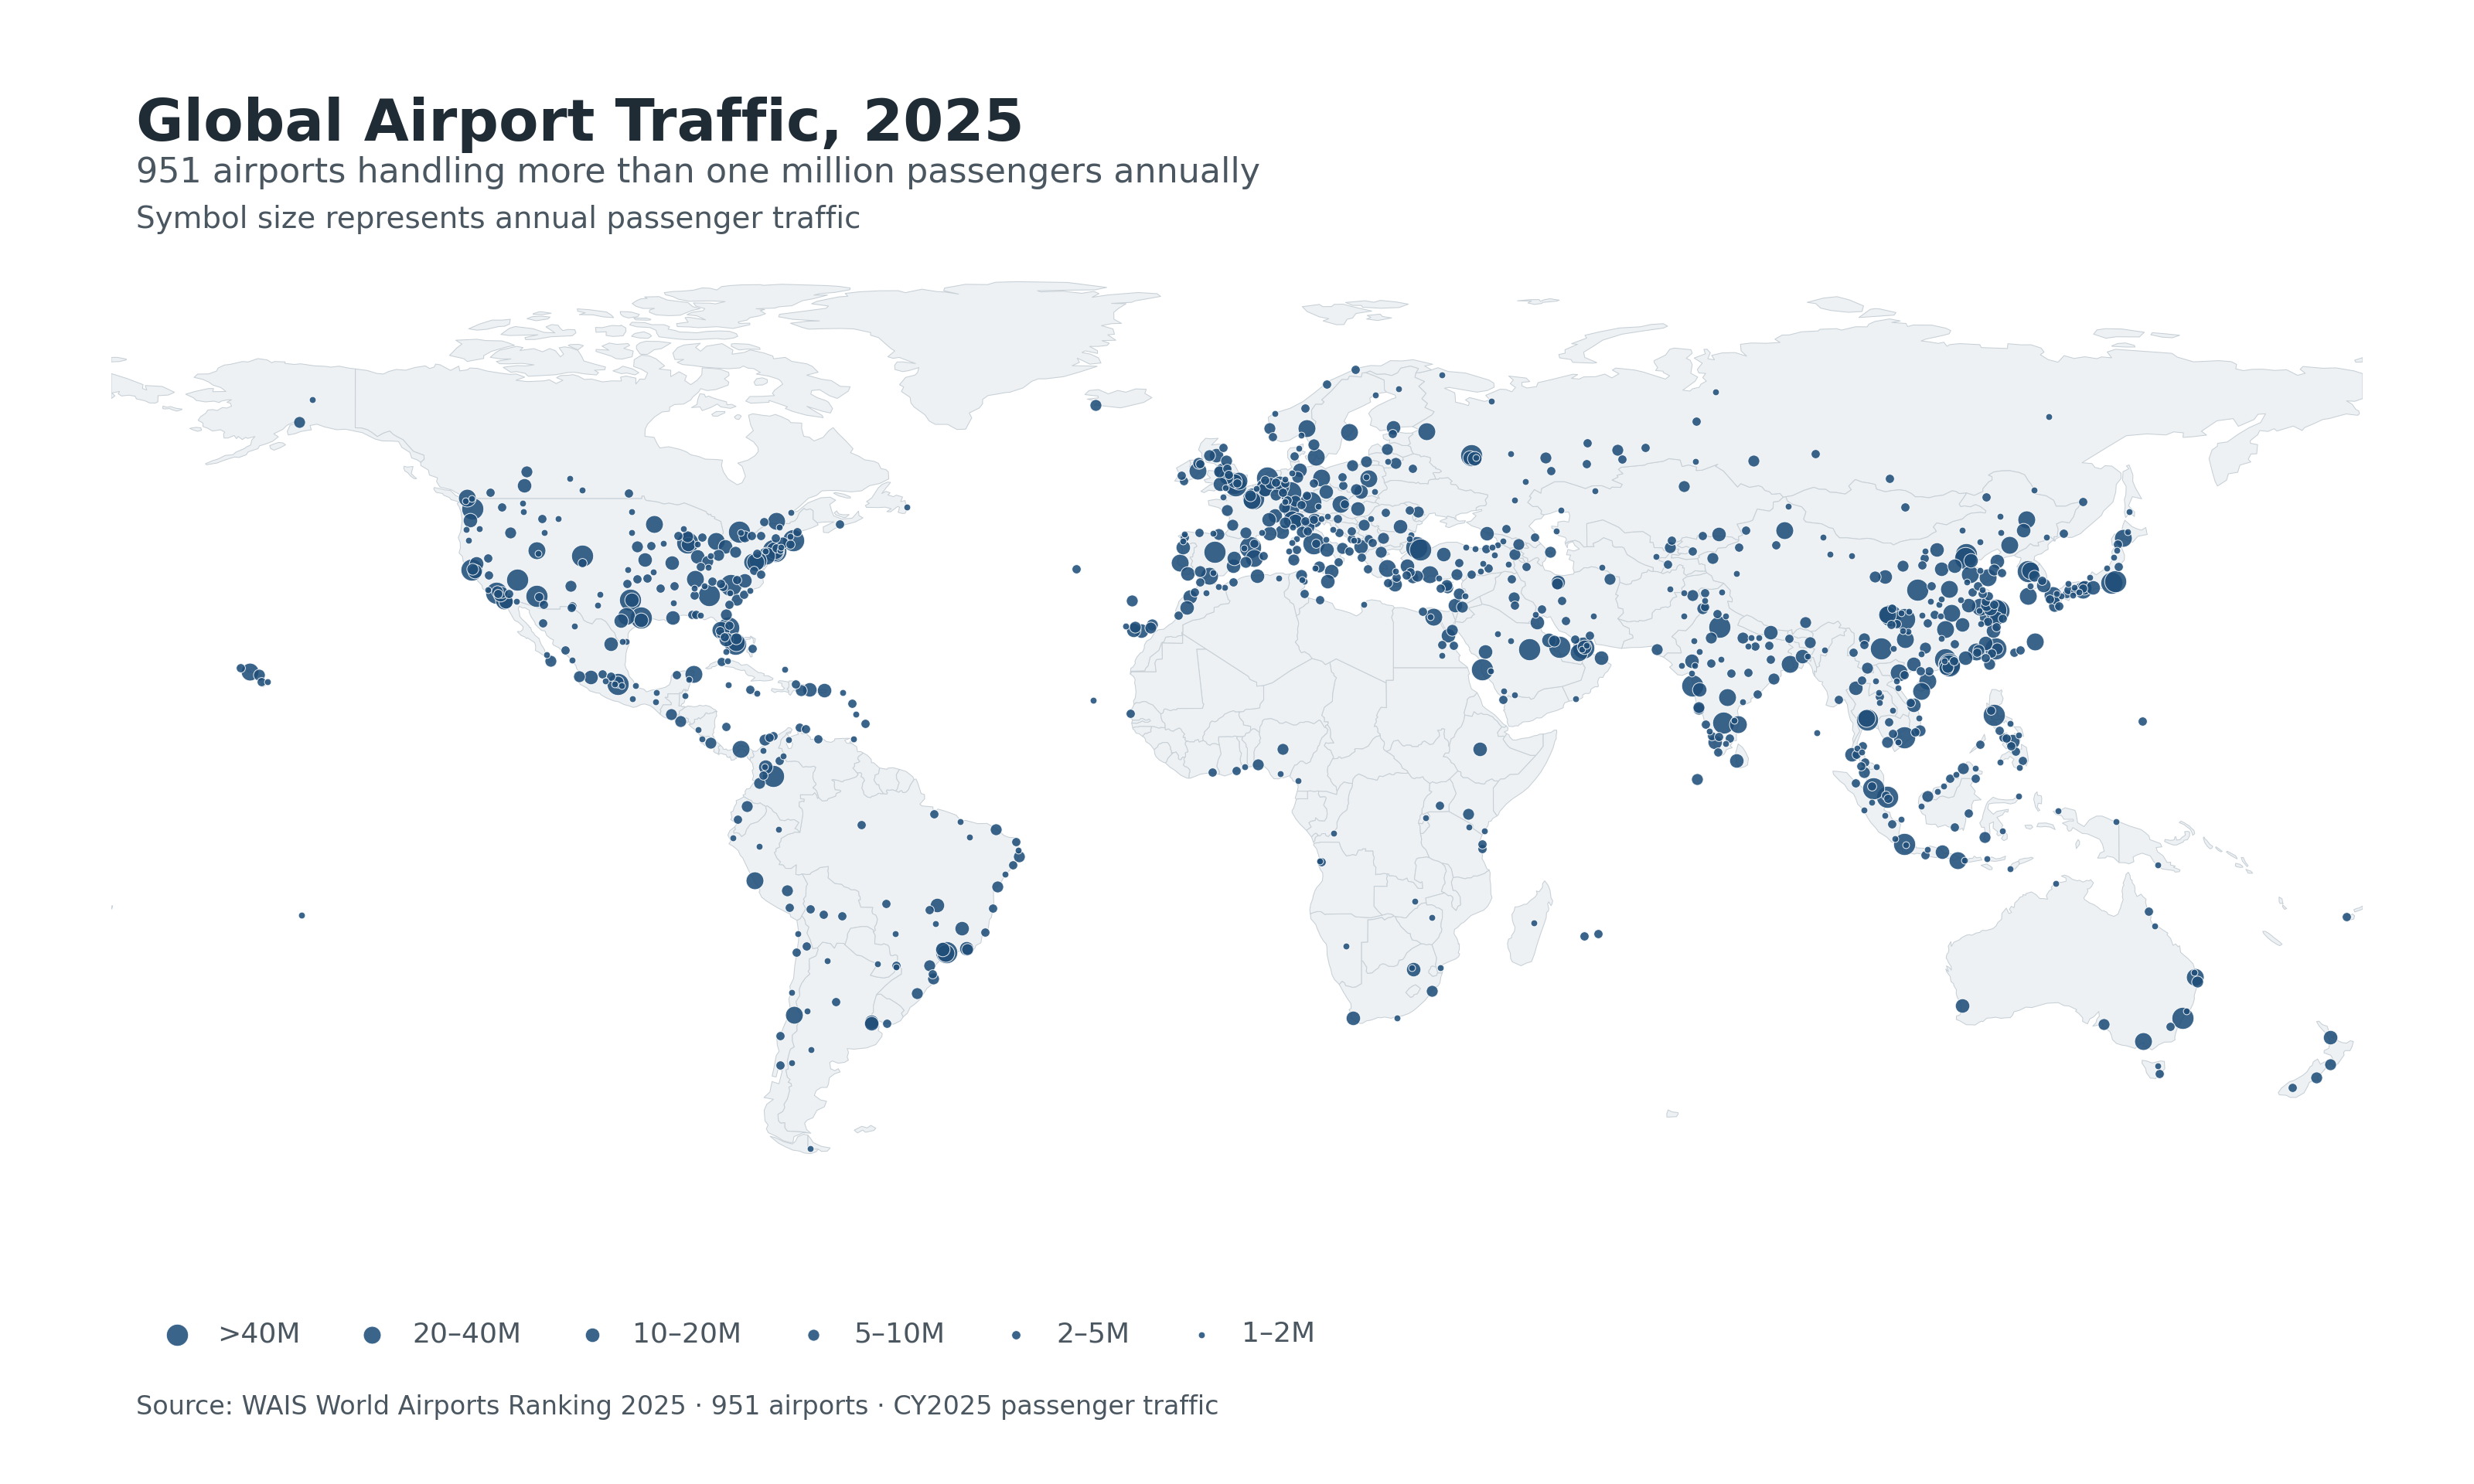
The largest airports form several clearly identifiable geographic concentrations. East Asia contains a dense network of very large airports extending across eastern China, Japan and the Korean Peninsula. North America’s largest airports are concentrated primarily in the United States, while Europe combines a particularly dense airport network with several of the world’s largest international gateways.
Other regions display a different spatial pattern. The Middle East contains fewer airports but several exceptionally large hubs concentrated around the Arabian Peninsula. South and Southeast Asia combine rapidly expanding metropolitan airport systems with major international gateways, while airport networks in Africa, South America and Oceania are more spatially dispersed.
182
MOST AIRPORTS
Europe
2.11BN
MOST PASSENGERS
East Asia
52.1%
AIRPORTS IN TOP 3 REGIONS
East Asia · North America · Europe
65.1%
50M THRESHOLD — CKG
East Asia · North America · Europe
WHERE THE WORLD’S LARGEST AIRPORTS CLUSTER
The geography of global airport traffic is dominated by three major regions. East Asia, North America and Europe each handled more than two billion passenger movements in 2025. Together, they accounted for nearly two thirds of passenger traffic across the 951 airports in the WAIS ranking.
Beyond these three centres, the distribution becomes considerably more dispersed. The Middle East and Southeast Asia each handled close to 700 million passengers, while South Asia and South America each approached half a billion. Africa, Oceania, Russia–Caucasus–Central Asia and the Mexico–Central America–Caribbean region form smaller, but geographically distinct, components of the global airport system.
GLOBAL PATTERNS
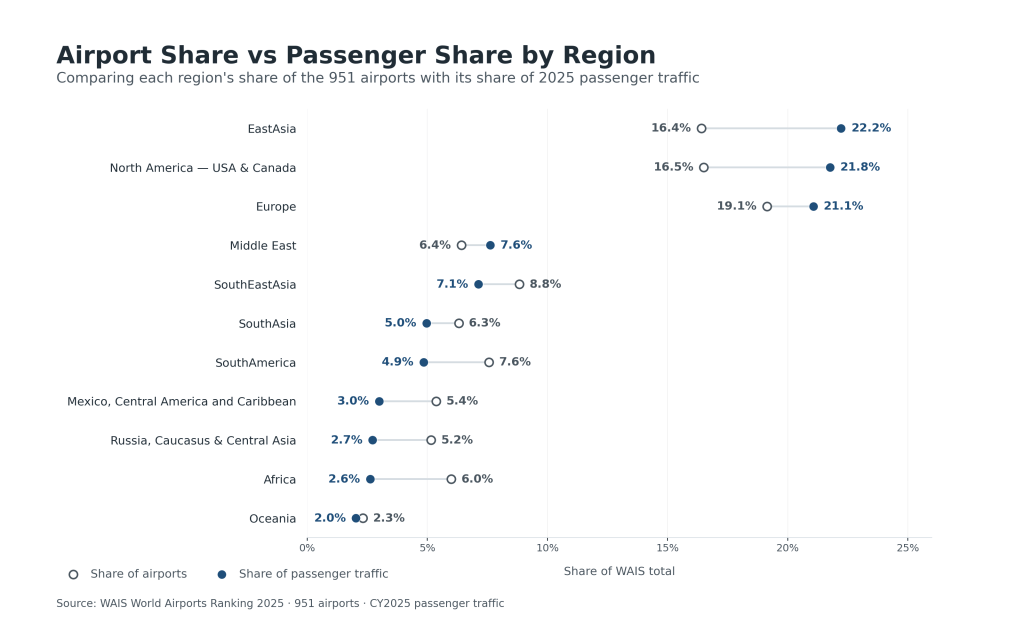
Global airport traffic is concentrated more strongly than the geographic distribution of major airports themselves. East Asia, North America and Europe contain 52.1% of the 951 airports in the WAIS ranking, but generate 65.1% of their passenger traffic. Each of these three regions handled more than two billion passenger movements in 2025.
East Asia records the largest passenger volume, with 2.11 billion passengers, followed by North America with 2.07 billion and Europe with 2.01 billion. Europe nevertheless contains the largest number of airports above the one-million-passenger threshold — 182, compared with 157 in North America and 156 in East Asia.
The relationship between airport numbers and traffic also varies substantially beyond the three largest regions. The Middle East accounts for 6.4% of airports but 7.6% of passenger traffic, while Africa contains 6.0% of airports but accounts for 2.6% of traffic. South America, Russia–Caucasus–Central Asia and the Mexico–Central America–Caribbean region likewise contain a larger share of airports than of passenger movements.
These differences show that the geography of aviation cannot be described by airport numbers alone. Regional airport systems differ not only in their geographic extent, but also in the scale of individual airports and the degree to which passenger traffic is concentrated in large metropolitan gateways.
REGIONAL PERSPECTIVE
The global map reveals several distinct forms of airport geography. Europe combines the world’s largest number of million-passenger airports with an exceptionally dense spatial network. East Asia has fewer qualifying airports than Europe but the largest overall passenger volume, reflecting the scale of its major metropolitan airport markets.
North America presents another highly concentrated system, dominated by the extensive airport network of the United States. The Middle East is much smaller in airport numbers but contains several very large gateways, giving the region a greater share of global traffic than its share of airports.
Southeast Asia, South Asia and South America form substantial secondary concentrations of global airport activity. Their airport systems extend across very different geographic environments, from continental metropolitan networks to archipelagic systems in which aviation plays an especially important role in long-distance connectivity.
Africa and Oceania have much lower aggregate passenger volumes, while the Russia–Caucasus–Central Asia and Mexico–Central America–Caribbean regions form geographically extensive but comparatively smaller components of the global system.
ABOUT THE DATA
This analysis is based on the WAIS World Airports Ranking 2025, covering 951 airports with at least one million passenger movements in calendar year 2025. Passenger traffic represents arrivals and departures; transit passengers are counted once where reported.
For comparative analysis, WAIS organizes the world’s airports into 11 geographic regions. The regional framework is designed to provide a consistent basis for global comparison while preserving major geographic and aviation-system distinctions.
Airport locations, passenger totals and regional assignments used in the visualizations are drawn from the WAIS 2025 airport dataset. Regional passenger totals are calculated from the individual airport records included in the ranking.
WAIS 003 · World Airports Ranking 2025
EXPLORE THE COMPLETE WORLD AIRPORTS RANKING 2025
Explore the complete global ranking, regional analysis, multi-airport systems and supporting data for 951 airports worldwide.
The Complete Edition provides the full global ranking and supporting analysis, while the accompanying dataset provides structured access to the underlying WAIS airport data for research and professional use.

