WAIS INSIGHT · AVIATION GEOGRAPHY
The World’s Largest Airport Markets: Countries in 2025
Airport traffic is highly concentrated not only in individual hubs and metropolitan systems, but also at the national level. In 2025, the United States and China together accounted for more than one-third of all passenger movements recorded across the 951 World busiet airports in the WAIS World Airports Ranking.
2025 DATA · NATIONAL AIRPORT MARKETS · PASSENGER TRAFFIC
KEY FINDINGS
1.92BN
LARGEST AIRPORT MARKET
United States · 141 airports
1.48BN
SECOND LARGEST
China · 109 airports
35.7%
UNITED STATES + CHINA
Combined share of passenger traffic across the 951 world busiest airports
59.3%
TOP 10 COUNTRIES
Share of total WAIS world airport passenger traffic
TWO MARKETS AT A DIFFERENT SCALE
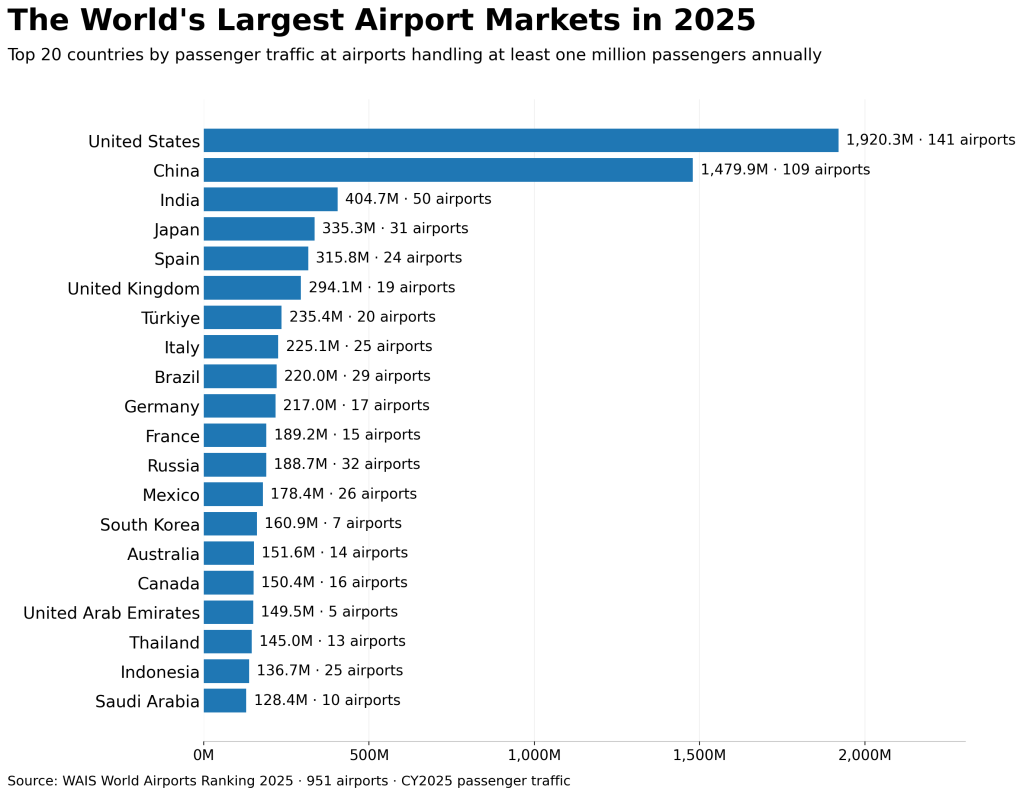
The national ranking is dominated by two airport markets operating at a scale far above the rest of the world. Airports in the United States handled approximately 1.92 billion passenger movements in 2025, while airports in China handled 1.48 billion. Together, the two countries accounted for 35.7% of all passenger traffic represented in the WAIS dataset.
The gap below them is substantial. India, the third-largest national market, recorded 404.7 million passenger movements — less than one-third of China’s total. Japan followed with 335.3 million, while Spain, at 315.8 million, was the largest European national market.
This separation at the top is one of the clearest structural features of the global airport system: national airport traffic is distributed across many countries, but a very large share is concentrated in the two largest markets.
SIZE OF MARKET, NUMBER OF AIRPORTS
The scale of a national airport market is not determined by the number of major airports alone. Countries with broadly similar numbers of airports handling more than one million passengers can differ substantially in total passenger traffic, while some very large markets are concentrated in relatively few airports.
The contrast is particularly clear among the leading markets. The United States combines the world’s largest passenger total with 141 airports above the one-million-passenger threshold, while China ranks second with 109. India follows with 50 airports, but its 404.7 million passengers place it far below the two largest markets.
Further down the ranking, the relationship becomes even less direct. Russia has 32 airports above the threshold and handled 188.7 million passengers, while South Korea has only seven but handled 160.9 million. The United Arab Emirates, with just five qualifying airports, recorded 149.5 million passengers — approaching the totals of countries with much larger airport networks.
These differences reveal two distinct dimensions of a national airport market: the overall scale of passenger traffic and the extent to which that traffic is distributed across the national airport network. A large number of major airports may indicate a geographically extensive system, while a high passenger total generated by relatively few airports indicates much stronger concentration at individual gateways.
CONCENTRATION AT THE TOP
Global airport traffic is distributed across a large number of national markets, but a substantial share is concentrated in a relatively small group of countries. The two largest markets — the United States and China — together accounted for 35.7% of passenger traffic across the 951 airports included in the WAIS ranking.
Adding India, Japan and Spain brings the combined share of the five largest markets to 46.8%. The Top 10 countries accounted for 59.3%, representing approximately 5.65 billion passenger movements.
The concentration remains pronounced beyond the very largest markets. Together, the Top 20 countries generated 7.23 billion passenger movements, or 75.9% of the WAIS total. The remaining quarter of traffic was distributed across the much larger number of national markets outside the Top 20.
This pattern shows that the geography of global airport traffic is simultaneously broad and highly concentrated: major airports operate across countries worldwide, but most passenger movements are generated within a comparatively small number of national aviation markets.
GEOGRAPHY OF THE LEADING MARKETS
The world’s largest national airport markets are spread across several major aviation regions, but their representation within the Top 20 is uneven. Europe has the largest number of countries in the group, including Spain, the United Kingdom, Türkiye, Italy, Germany and France, while Russia forms the largest national market within the WAIS Russia, Caucasus & Central Asia region.
North America contributes the United States and Canada, with Mexico representing the Mexico, Central America & Caribbean region. East Asia includes China, Japan and South Korea, while South Asia is represented by India. Southeast Asia contributes Thailand and Indonesia, and Oceania is represented by Australia.
The Middle East has two particularly concentrated national markets in the Top 20: the United Arab Emirates and Saudi Arabia. South America is represented by Brazil, whose 220.0 million passenger movements make it the region’s largest national airport market.
The ranking therefore reveals a different geography from a simple regional comparison. Large national airport markets emerge from very different combinations of population, urban structure, domestic aviation and international connectivity. Their position in the ranking describes the scale of airport activity within a country, but not a single model of how that activity is organized.
ABOUT THE DATA
This analysis is based on the WAIS World Airports Ranking 2025, covering 951 airports worldwide handling at least one million passengers annually.
National market totals are calculated by aggregating passenger traffic at all qualifying airports within each country. Figures represent calendar-year 2025 traffic wherever full-year data are available, applying the WAIS source hierarchy and estimation rules where necessary.
Passenger traffic refers to airport passenger movements (arrivals and departures), not unique travellers. The same person may therefore be counted at more than one airport during a journey.
Geographic treatment. Countries are aggregated independently of the eleven WAIS analytical regions. Hong Kong and Macao are treated separately from mainland China, consistently with the WAIS geographic framework.
The figures describe traffic within the defined WAIS dataset rather than the complete national aviation market: airports handling fewer than one million passengers are not included in national totals.
WAIS 003 · World Airports Ranking 2025
EXPLORE THE COMPLETE WORLD AIRPORTS RANKING 2025
The complete WAIS 003 publication provides global rankings, regional analysis and reference material covering 951 airports and 76 multi-airport systems worldwide.

