WAIS INSIGHT · AVIATION GEOGRAPHY
One Million Passengers: Mapping the World’s Major Airports
Crossing one million annual passengers marks an important transition in airport scale. In 2025, 951 airports worldwide exceeded this threshold, forming a remarkably extensive but geographically uneven network of major passenger airports.
2025 DATA · 951 AIRPORTS · 1M+ PASSENGERS
KEY FINDINGS
951
MAJOR AIRPORTS
Airports handling at least one million passengers in 2025.
182
LARGEST REGIONAL NETWORK
Europe contains the largest number of 1M+ airports.
157
NORTH AMERICA
The United States and Canada form the second-largest regional network.
156
EAST ASIA
East Asia has almost the same number of major airports, but substantially greater passenger traffic.
A GLOBAL NETWORK, UNEVENLY DISTRIBUTED
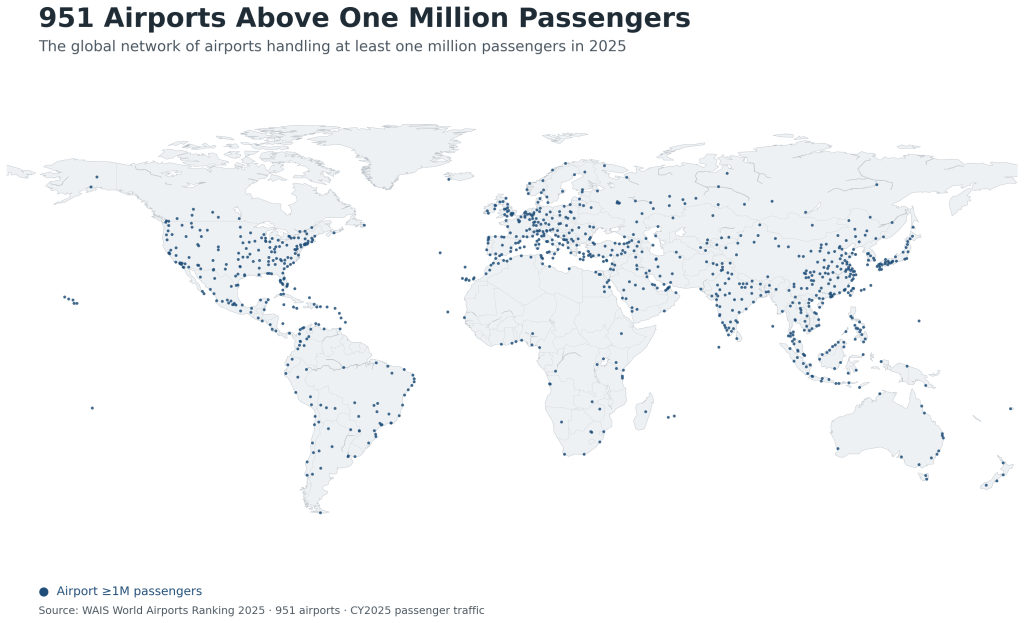
The 951 airports handling at least one million passengers in 2025 form a global network extending across every major inhabited region of the world. Yet the map reveals immediately that this network is far from evenly distributed.
The greatest concentrations occur across Europe, eastern North America and the principal urban and economic corridors of East Asia. Dense groups are also visible in South and Southeast Asia, while other parts of the world contain much more widely separated major airports.
These differences reflect more than the overall scale of regional air travel. They also reveal how differently airport networks are distributed across territory. Some regions support large numbers of airports within relatively compact geographic areas, while others depend on a smaller number of widely separated gateways serving extensive territories.
The one-million-passenger threshold therefore provides a useful way of seeing the spatial structure of the global airport system. Instead of emphasizing the largest hubs, every airport crossing the same traffic threshold is given equal visual weight.
DENSITY AND GEOGRAPHIC REACH
Europe contains the largest number of airports in the WAIS dataset, with 182 airports handling at least one million passengers in 2025. Their geographic distribution produces one of the world’s densest major-airport networks, extending across a comparatively compact area and connecting numerous national and metropolitan markets.
North America — defined in WAIS as the United States and Canada — follows with 157 airports. Here the network extends across a much larger territory. Dense airport concentrations around major population centres coexist with long distances between airports across less densely populated parts of the continent.
East Asia contains 156 qualifying airports, almost the same number as North America. Its spatial pattern, however, is markedly different. Major airports are concentrated particularly strongly within the region’s principal urban and economic corridors, producing dense clusters alongside areas with much lower airport density.
Elsewhere, the network becomes progressively more dispersed. Southeast Asia and South Asia contain substantial groups of major airports associated with large population centres and rapidly developing air markets. In South America, Africa, the Middle East, Oceania and the Russia–Caucasus–Central Asia region, major airports are generally distributed across much larger spaces, often with substantial distances between neighbouring airports.
The result is a global airport network whose geography cannot be described simply by counting airports. The same number of airports can represent very different spatial systems, depending on the size of the territory, the distribution of population and cities, and the organization of national and regional air transport.
WHAT THE ONE-MILLION THRESHOLD REVEALS
One million annual passengers is not a universal definition of a major airport, nor does crossing the threshold imply a particular function within the aviation system. In WAIS 003, it provides a consistent quantitative boundary for constructing a worldwide airport dataset on a comparable basis.
This distinction is important. An airport handling slightly more than one million passengers may be a remote regional gateway, an important island airport, a secondary airport within a large metropolitan system or part of a dense national airport network. At the other end of the same dataset are airports handling more than 50 million — and, in the case of Atlanta in 2025, more than 100 million — passengers annually.
Applying a common minimum threshold makes these very different airports visible within a single geographic framework. It captures airports large enough to represent substantial scheduled passenger activity while retaining far more of the global network than a ranking restricted to the world’s largest hubs.
The map therefore complements conventional airport rankings. A ranking shows hierarchy; the one-million-passenger map shows presence, distribution and geographic reach. Together, the two perspectives reveal both where the largest concentrations of traffic occur and how broadly the major-airport network extends across the world.
A NETWORK OF REGIONAL SYSTEMS
The global pattern is also the product of multiple regional airport systems rather than a single uniform network. Of the 951 airports in the dataset, Europe contains 182, North America 157 and East Asia 156. Together these three regions account for 495 airports — just over half of the global dataset.
The remaining 456 airports are distributed across eight other WAIS regions. Southeast Asia contains 84 airports, South America 72, the Middle East 61, South Asia 60, Africa 57, Mexico–Central America–Caribbean 51, Russia–Caucasus–Central Asia 49 and Oceania 22.
These figures add another dimension to the map. Regions with relatively few airports can still contain extremely important global gateways, while regions with large numbers of qualifying airports may distribute passenger activity across a much broader network. Airport count, airport size and total regional traffic are therefore related but distinct measures of the global aviation system.
For WAIS, this is one reason to preserve a regional framework alongside global rankings: the worldwide airport network becomes more informative when its individual airports are understood as components of larger geographic systems.
ABOUT THE DATA
This analysis is based on the WAIS World Airports Ranking 2025, which includes 951 airports across 11 world regions.
The dataset includes airports handling at least one million passenger movements in 2025. Passenger movements represent arriving and departing passengers, with direct transit passengers counted once where applicable. Calendar-year figures are used wherever available, following the WAIS source hierarchy and estimation procedures where complete calendar-year data are unavailable.
Each point on the map represents one airport and is plotted using its geographic coordinates. All airport markers are shown at the same size regardless of passenger traffic. The map therefore represents the geographic distribution of qualifying airports rather than the relative scale of their passenger volumes.
The one-million-passenger threshold defines the scope of the WAIS 003 airport ranking. It should not be interpreted as a functional classification: airport function is addressed separately within the WAIS Airport Functional Classification framework.
The 951-airport dataset and the WAIS Multi-Airport Systems framework also have different boundaries. A multi-airport system may include smaller member airports below the one-million-passenger threshold where they form part of the same metropolitan airport system.
WAIS 003 · World Airports Ranking 2025
Explore the global airport system
The full WAIS 003 publication provides global and regional rankings, maps, geographic analysis and reference material covering 951 airports and 76 multi-airport systems worldwide.

