WAIS INSIGHT · AIRPORT RANKINGS
The World’s 100 Busiest Airports in 2025
The world’s largest airports handled an extraordinary concentration of global passenger traffic in 2025. The WAIS Top 100 accounted for 4.94 billion passenger movements — more than half of all traffic recorded across the 951 airports handling more than one million passengers annually in the WAIS World Airports Ranking 2025.
2025 DATA · PASSENGER TRAFFIC · WAIS WORLD AIRPORTS RANKING
KEY FINDINGS
106.3M
WORLD’S BUSIEST AIRPORT
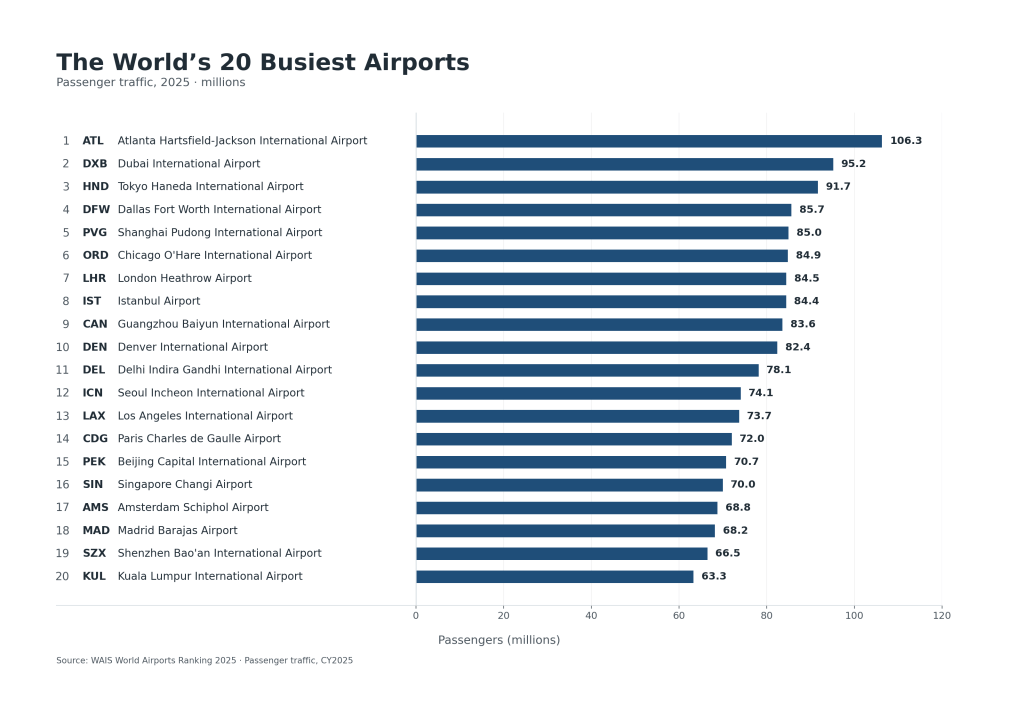
Atlanta Hartsfield-Jackson International Airport (ATL) ranks first with 106,302,208 passengers.
4.94BN
TOP 100 AIRPORTS
The world’s 100 busiest airports handled approximately 4.94 billion passengers in 2025.
51.9%
OF WAIS TRAFFIC
Just 100 airports account for 51.9% of passenger traffic across the 951 airports in the WAIS ranking.
27.4M
TOP 100 THRESHOLD
Lima Jorge Chavez International Airport (LIM), ranked 100th, handled 27,420,159 passengers.
THE GLOBAL TOP 100
The WAIS World Airports Ranking 2025 covers 951 airports worldwide, each handling more than one million passengers annually. Airports are ranked by total 2025 passenger traffic on a common global basis. The table below presents the 100 busiest airports within this 951-airport global dataset.
| # | AIRPORT | IATA | COUNTRY | PASSENGERS |
|---|---|---|---|---|
| 1 | Atlanta Hartsfield-Jackson International Airport | ATL | USA | 106,302,208 |
| 2 | Dubai International Airport | DXB | ARE | 95,192,160 |
| 3 | Tokyo Haneda International Airport | HND | JPN | 91,679,814 |
| 4 | Dallas Fort Worth International Airport | DFW | USA | 85,660,127 |
| 5 | Shanghai Pudong International Airport | PVG | CHN | 84,994,548 |
| 6 | Chicago O’Hare International Airport | ORD | USA | 84,851,825 |
| 7 | London Heathrow Airport | LHR | GBR | 84,482,126 |
| 8 | Istanbul Airport | IST | TUR | 84,437,710 |
| 9 | Guangzhou Baiyun International Airport | CAN | CHN | 83,582,952 |
| 10 | Denver International Airport | DEN | USA | 82,427,962 |
| 11 | Delhi Indira Gandhi International Airport | DEL | IND | 78,148,081 |
| 12 | Seoul Incheon International Airport | ICN | KOR | 74,071,475 |
| 13 | Los Angeles International Airport | LAX | USA | 73,709,594 |
| 14 | Paris Charles de Gaulle Airport | CDG | FRA | 72,029,407 |
| 15 | Beijing Capital International Airport | PEK | CHN | 70,742,712 |
| 16 | Singapore Changi Airport | SIN | SGP | 69,980,000 |
| 17 | Amsterdam Schiphol Airport | AMS | NLD | 68,770,805 |
| 18 | Madrid Barajas Airport | MAD | ESP | 68,179,054 |
| 19 | Shenzhen Bao’an International Airport | SZX | CHN | 66,485,213 |
| 20 | Kuala Lumpur International Airport | KUL | MYS | 63,326,064 |
| 21 | Frankfurt Airport | FRA | DEU | 63,186,114 |
| 22 | Bangkok Suvarnabhumi Airport | BKK | THA | 62,902,056 |
| 23 | New York John F. Kennedy International Airport | JFK | USA | 62,629,455 |
| 24 | Hong Kong International Airport | HKG | HKG | 60,992,000 |
| 25 | Orlando International Airport | MCO | USA | 57,675,573 |
| 26 | Barcelona El Prat Airport | BCN | ESP | 57,483,036 |
| 27 | Chengdu Tianfu International Airport | TFU | CHN | 56,686,738 |
| 28 | Mumbai Chhatrapati Shivaji International Airport | BOM | IND | 55,492,394 |
| 29 | Miami International Airport | MIA | USA | 55,314,661 |
| 30 | Las Vegas Harry Reid International Airport | LAS | USA | 54,989,185 |
| 31 | Jakarta Soekarno Hatta International Airport | CGK | IDN | 54,940,134 |
| 32 | San Francisco International Airport | SFO | USA | 54,532,613 |
| 33 | Doha Hamad International Airport | DOH | QAT | 54,351,133 |
| 34 | Beijing Daxing International Airport | PKX | CHN | 53,618,949 |
| 35 | Charlotte Douglas International Airport | CLT | USA | 53,574,392 |
| 36 | Jeddah King Abdulaziz International Airport | JED | SAU | 53,538,280 |
| 37 | Seattle Tacoma International Airport | SEA | USA | 52,715,181 |
| 38 | Manila Ninoy Aquino International Airport | MNL | PHL | 52,020,551 |
| 39 | Phoenix Sky Harbor International Airport | PHX | USA | 51,620,420 |
| 40 | Rome Leonardo da Vinci Fiumicino Airport | FCO | ITA | 50,987,924 |
| 41 | Hangzhou Xiaoshan International Airport | HGH | CHN | 50,459,018 |
| 42 | Shanghai Hongqiao International Airport | SHA | CHN | 50,151,025 |
| 43 | Chongqing Jiangbei International Airport | CKG | CHN | 50,094,770 |
| 44 | Kunming Changshui International Airport | KMG | CHN | 49,705,725 |
| 45 | Xi’an Xianyang International Airport | XIY | CHN | 48,535,594 |
| 46 | Istanbul Sabiha Gokcen International Airport | SAW | TUR | 48,407,318 |
| 47 | Houston George Bush Intercontinental Airport | IAH | USA | 48,131,213 |
| 48 | Taipei Taoyuan International Airport | TPE | TWN | 47,795,969 |
| 49 | Toronto Pearson International Airport | YYZ | CAN | 47,300,000 |
| 50 | Sao Paulo Guarulhos International Airport | GRU | BRA | 47,188,085 |
| 51 | New York Newark Liberty International Airport | EWR | USA | 47,000,085 |
| 52 | Bogota El Dorado International Airport | BOG | COL | 45,470,707 |
| 53 | Mexico City International Airport | MEX | MEX | 44,605,800 |
| 54 | Bengaluru Kempegowda International Airport | BLR | IND | 43,817,465 |
| 55 | Moscow Sheremetyevo International Airport | SVO | RUS | 43,427,591 |
| 56 | Munich Airport | MUC | DEU | 43,394,442 |
| 57 | Boston Logan International Airport | BOS | USA | 43,236,013 |
| 58 | London Gatwick Airport | LGW | GBR | 42,771,000 |
| 59 | Sydney Kingsford Smith Airport | SYD | AUS | 42,566,527 |
| 60 | Ho Chi Minh City International Airport | SGN | VNM | 42,413,299 |
| 61 | Tokyo Narita International Airport | NRT | JPN | 42,255,291 |
| 62 | Riyadh King Khalid International Airport | RUH | SAU | 40,078,594 |
| 63 | Antalya Airport | AYT | TUR | 39,000,177 |
| 64 | Melbourne Airport | MEL | AUS | 36,694,074 |
| 65 | Dublin Airport | DUB | IRL | 36,402,926 |
| 66 | Lisbon Humberto Delgado Airport | LIS | PRT | 36,126,000 |
| 67 | Minneapolis Saint Paul International Airport | MSP | USA | 36,071,627 |
| 68 | Paris Orly Airport | ORY | FRA | 34,928,909 |
| 69 | Osaka Kansai International Airport | KIX | JPN | 34,096,882 |
| 70 | Athens Eleftherios Venizelos | ATH | GRC | 33,993,746 |
| 71 | Hanoi Noi Bai International Airport | HAN | VNM | 33,901,329 |
| 72 | Palma de Mallorca Airport | PMI | ESP | 33,806,427 |
| 73 | Chengdu Shuangliu International Airport | CTU | CHN | 33,518,945 |
| 74 | Detroit Metropolitan Wayne County Airport | DTW | USA | 33,370,000 |
| 75 | New York LaGuardia Airport | LGA | USA | 32,791,050 |
| 76 | Zurich Airport | ZRH | CHE | 32,593,966 |
| 77 | Vienna International Airport | VIE | AUT | 32,559,115 |
| 78 | Abu Dhabi Zayed International Airport | AUH | ARE | 32,488,724 |
| 79 | Copenhagen Airport | CPH | DNK | 32,433,694 |
| 80 | Fort Lauderdale Hollywood International Airport | FLL | USA | 32,208,419 |
| 81 | Manchester Airport | MAN | GBR | 32,117,556 |
| 82 | Jeju International Airport | CJU | KOR | 31,648,915 |
| 83 | Bangkok Don Mueang International Airport | DMK | THA | 31,644,453 |
| 84 | Nanjing Lukou International Airport | NKG | CHN | 31,378,166 |
| 85 | Milan Malpensa Airport | MXP | ITA | 31,372,691 |
| 86 | Wuhan Tianhe International Airport | WUH | CHN | 31,339,277 |
| 87 | Cairo International Airport | CAI | EGY | 31,137,557 |
| 88 | Hyderabad Rajiv Gandhi International Airport | HYD | IND | 30,993,603 |
| 89 | Changsha Huanghua International Airport | CSX | CHN | 30,253,675 |
| 90 | Philadelphia International Airport | PHL | USA | 30,136,790 |
| 91 | London Stansted Airport | STN | GBR | 30,047,146 |
| 92 | Cancun International Airport | CUN | MEX | 29,478,653 |
| 93 | Xiamen Gaoqi International Airport | XMN | CHN | 29,193,712 |
| 94 | Zhengzhou Xinzheng International Airport | CGO | CHN | 29,191,990 |
| 95 | Urumqi Tianshan International Airport | URC | CHN | 29,179,737 |
| 96 | Washington Dulles International Airport | IAD | USA | 29,008,830 |
| 97 | Okinawa Naha Airport | OKA | JPN | 28,962,160 |
| 98 | Fukuoka Airport | FUK | JPN | 28,384,582 |
| 99 | Salt Lake City International Airport | SLC | USA | 28,158,007 |
| 100 | Lima Jorge Chavez International Airport | LIM | PER | 27,420,159 |
TRAFFIC CONCENTRATION
Passenger traffic is strongly concentrated at the upper end of the global airport hierarchy. The ten largest airports alone account for 9.3% of passenger traffic across the 951 airports in the WAIS ranking. The share rises to 19.9% for the Top 25 and 33.6% for the Top 50.
By the time the ranking reaches 100 airports, cumulative traffic exceeds half of the WAIS total: 51.9%. The remaining 48.1% is distributed across 851 airports.
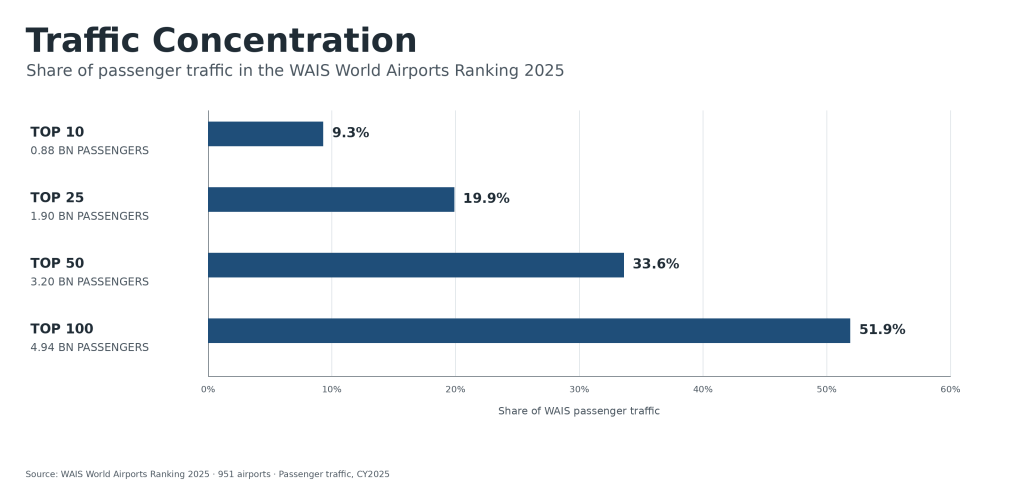
This concentration illustrates the steep hierarchy of the global airport system. Although the WAIS ranking includes 951 airports handling more than one million passengers annually, a relatively small group of very large airports accounts for a disproportionate share of total passenger activity.
A GLOBAL RANKING — BUT NOT AN EVENLY DISTRIBUTED ONE
The global Top 100 is geographically diverse, but the largest airports are not evenly distributed between countries. The United States has 23 airports in the Top 100, while China has 18. Together, the two countries account for 41 of the world’s 100 busiest airports.
Japan follows with five airports, while the United Kingdom and India each have four. Türkiye and Spain each have three, and a further ten countries have two airports represented in the Top 100. Another 20 countries and territories are represented by a single airport each, demonstrating the broad geographic reach of the global ranking beyond its most concentrated national markets.
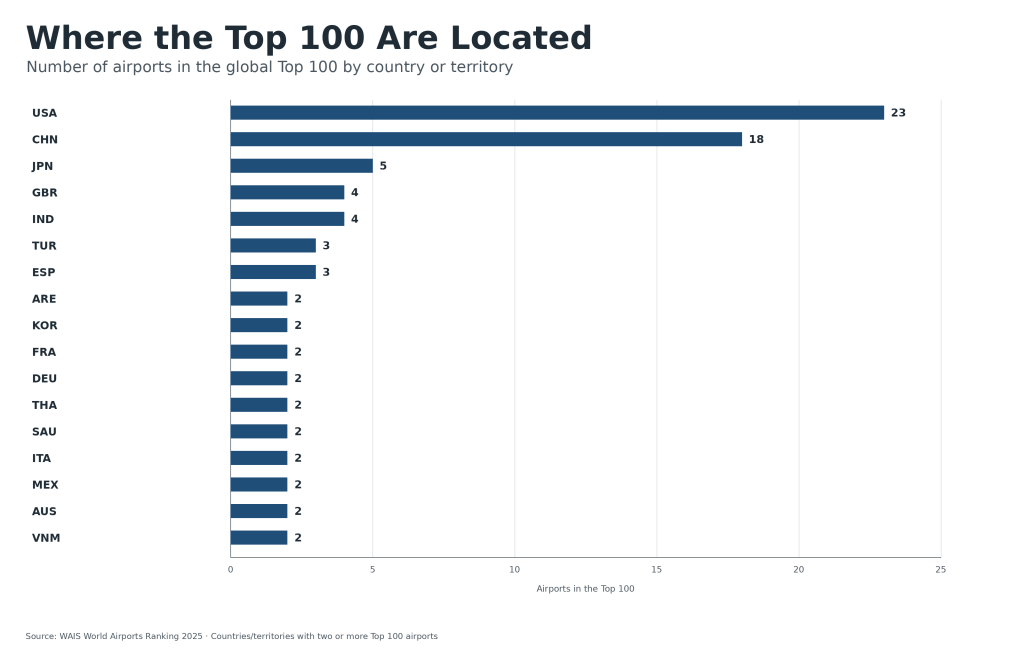
The distribution demonstrates that global airport scale is shaped by both very large national aviation markets and major international gateway systems. At the same time, the presence of airports from a much wider group of countries underlines the genuinely global character of the upper tier of the airport system.
THE 50-MILLION-PASSENGER CLUB
In 2025, 43 airports in the WAIS ranking handled more than 50 million passengers. The group extends from Atlanta Hartsfield-Jackson International Airport at 106.3 million passengers to Chongqing Jiangbei International Airport at 50.1 million.
These airports form the highest-volume tier of the global airport system. They include major international hubs, very large domestic gateways and airports serving some of the world’s largest metropolitan and aviation markets. Their similar traffic scale, however, does not necessarily imply a similar function within the aviation system.
43
AIRPORTS ABOVE 50M
106.3M
LARGEST — ATL
50.1M
50M THRESHOLD — CKG
SIZE IS NOT FUNCTION
Passenger traffic provides a common measure of airport scale, but size alone does not describe an airport’s role in the aviation system. Airports handling similar numbers of passengers may perform very different functions — from global hubs connecting multiple world regions to tourism gateways or airports primarily serving large national markets.
WAIS therefore treats passenger rank and airport function as complementary dimensions. The World Airports Ranking 2025 measures airport scale through passenger traffic, while the WAIS Airport Functional Classification System (AFCS) identifies the dominant functional role of each airport within the wider aviation system.
The Top 100 should therefore be read as a ranking of scale, not as a hierarchy of functional importance. Traffic volume shows how large an airport is; functional classification helps explain what role it performs.
ABOUT THE DATA
The WAIS World Airports Ranking 2025 covers 951 airports worldwide handling more than one million passengers annually. Together, these airports recorded approximately 9.52 billion passenger movements in 2025 and form the reference population used for the global ranking presented in this Insight.
Airports are ranked using calendar-year 2025 passenger traffic wherever available, or the best-supported 2025 value available within the WAIS data framework. Passenger traffic represents arrivals and departures, with transit passengers counted once unless the reporting convention of the original source differs.
WAIS prioritizes official airport and airport-operator statistics, civil aviation authorities and other government sources, followed where necessary by established industry sources and supporting references. Reported values are distinguished from derived, rounded and estimated figures within the underlying WAIS dataset.
951
AIRPORTS >1M
9.52BN
PASSENGER MOVEMENTS
2025
REFERENCE YEAR
11
WORLD REGIONS
WAIS 003 · World Airports Ranking 2025
EXPLORE THE COMPLETE WORLD AIRPORTS RANKING 2025
This Insight presents the public Top 100 of the WAIS World Airports Ranking 2025. The complete ranking covers 951 airports handling more than one million passengers annually across 11 world regions and integrates passenger traffic with airport functional classification and a wider set of airport-system indicators.
The Complete Edition provides the full global ranking and supporting analysis, while the accompanying dataset provides structured access to the underlying WAIS airport data for research and professional use.

